As fall settles in, the Salt Lake County single-family housing market continues to move—and October brought some subtle but meaningful shifts. Below is a clear breakdown of how the market changed from September to October, plus year-over-year trends and what they tell us about current buyer and seller behavior.
Homes Available
-
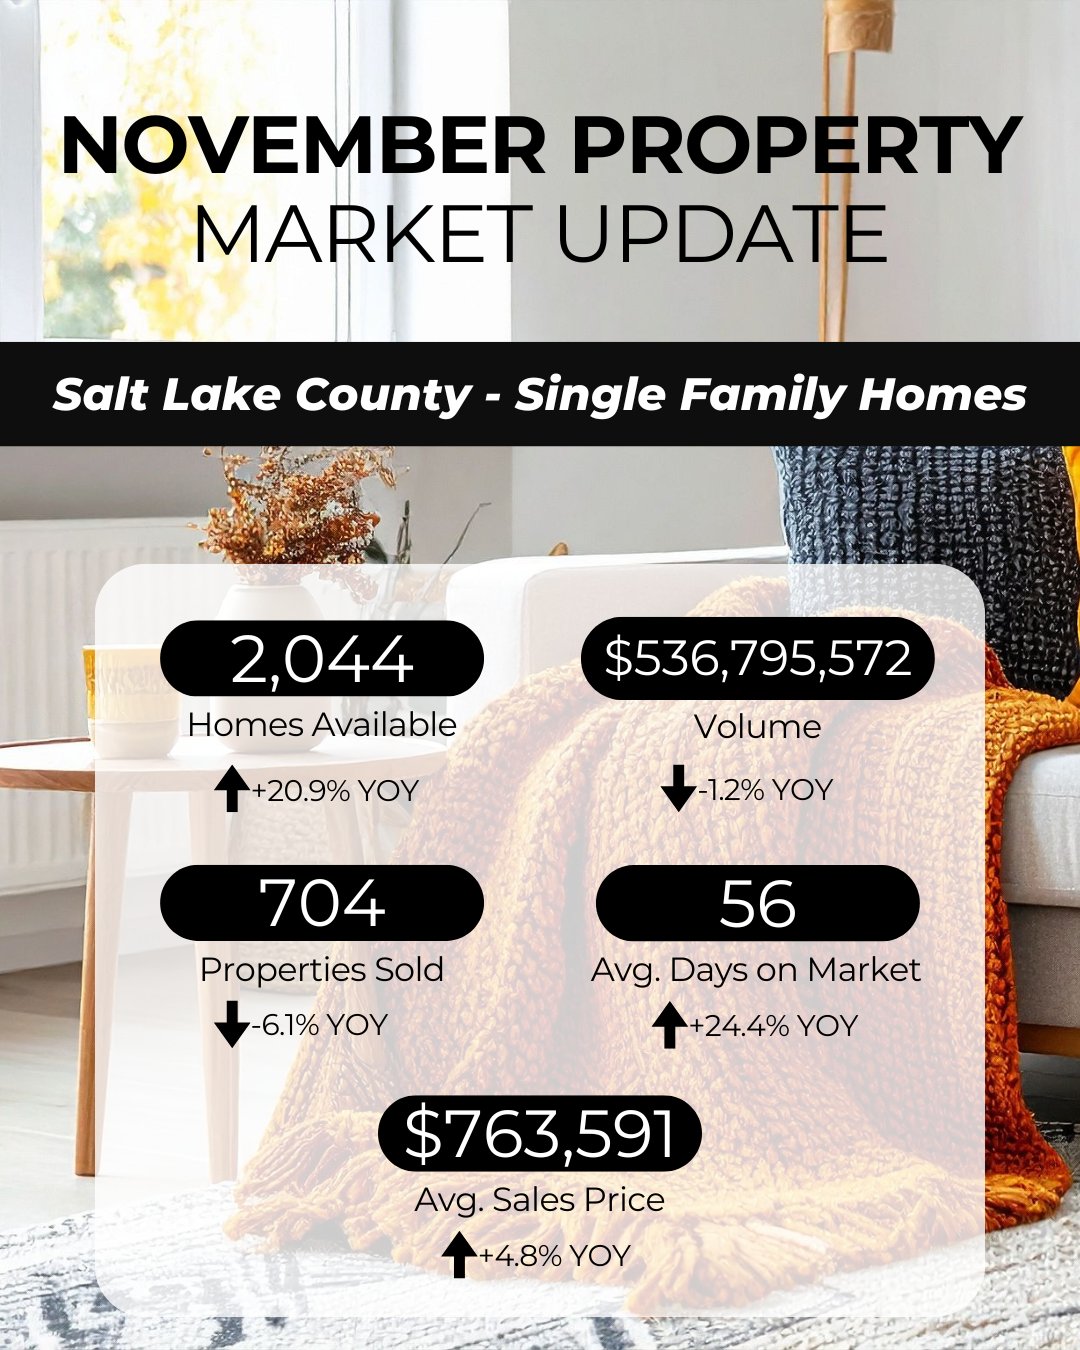
October: 2,044 homes (+20.9% YOY)
-
September: 2,064 homes (+21.7% YOY)
What it means:
Inventory remained high compared to last year, even with a small month-to-month drop. With more homes available than in 2023, buyers have more options and slightly more negotiating power. Sellers should expect longer market times and the need for strategic pricing.
Properties Sold
-
October: 704 homes closed (-6.1% YOY)
-
September: 692 homes closed (-4.2% YOY)
What it means:
Closings remained steady from September to October, but both months trailed last year. Higher interest rates and buyer caution continue to shape activity. Still, homes are selling—especially when priced and marketed correctly.
Total Sales Volume
-
October: $536,795,572 (-1.2% YOY)
-
September: $535,331,610 (+5.9% YOY)
What it means:
Sales volume held strong month-to-month, showing that buyers in the market are still willing to purchase higher-priced homes. Even with fewer sales overall, values remain competitive and sellers with well-prepared homes are seeing solid results.
Average Days on Market
-
October: 56 days (+24.4% YOY)
-
September: 51 days (+24.4% YOY)
What it means:
Homes are taking a bit longer to sell, which is typical for fall and reflective of higher inventory. Sellers shouldn’t panic—longer days on market are normal in a balanced or shifting market. Correct pricing and strong presentation still make a noticeable difference.
Average Sales Price
-
October: $763,591 (+4.8% YOY)
-
September: $773,600 (+5.7% YOY)
What it means:
While the average price dipped slightly from September, prices are still significantly higher than last year. Year-over-year growth shows that values remain stable, and homeowners continue to build equity.
Bottom Line
-
Inventory is up.
-
Prices remain strong.
-
Homes are taking longer to sell.
-
Sales volume and buyer activity are steady, even with seasonal slowdown.
Buyers are gaining more choices and breathing room.
Sellers can still succeed—especially when their home is priced strategically and stands out in a competitive market.
If you’re considering buying, selling, or just want to understand how these trends affect your neighborhood, I’m here to help you make sense of it. Reach out anytime for a personalized market update or a home valuation.