
As we move closer to spring, the Salt Lake County real estate market is beginning to show signs of seasonal momentum. Comparing January and February’s numbers helps give a clearer picture of how buyer activity, inventory, and pricing are evolving as the year gets underway.
Below is a breakdown of the latest single-family home data and what it may signal for buyers and sellers in the local market.
Inventory Is Gradually Increasing
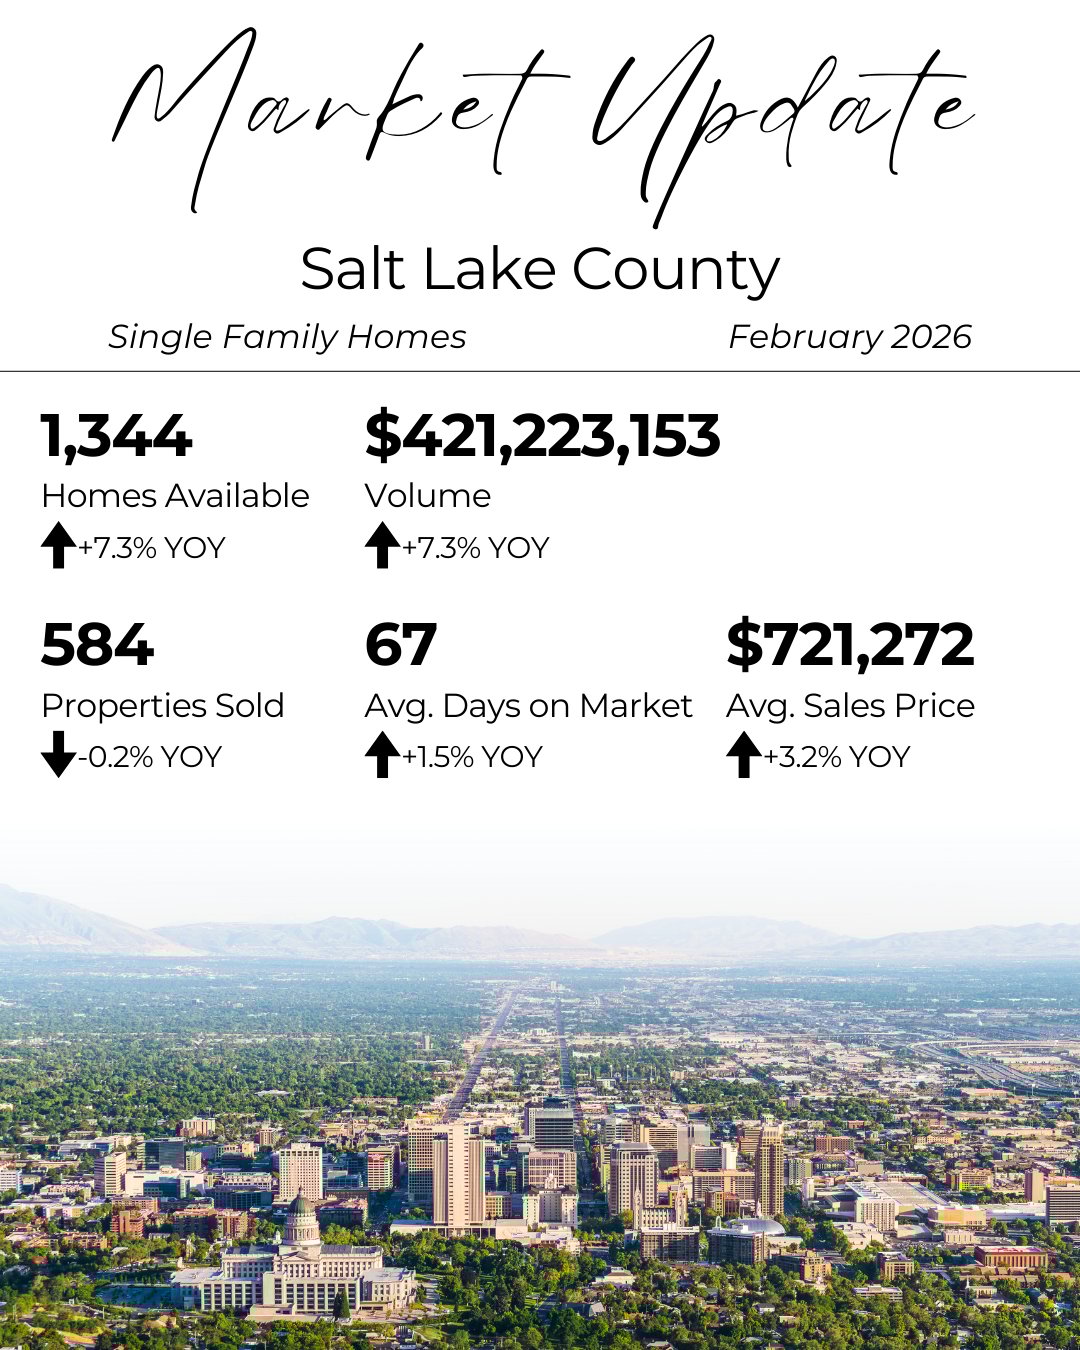
In February, Salt Lake County had 1,344 homes available, compared to 1,313 in January. This modest increase suggests that new listings are slowly entering the market as homeowners begin preparing for the spring selling season.
Year over year, inventory is also slightly higher. February inventory was up 7.3% compared to last year, while January inventory was up 6.8% year over year. While this doesn’t represent a major surge in supply, it does indicate that buyers may be starting to see more options compared to the tight inventory conditions of recent years.
For buyers, this can mean a little more choice and slightly less urgency than in extremely competitive periods.
Sales Activity Picked Up in February
One of the most noticeable shifts between the two months was the number of homes sold.
In January, 437 properties sold, while February saw 584 sales. That’s a significant increase month over month and reflects the typical seasonal pattern where activity begins to build as winter winds down.
However, when comparing to last year, sales are still slightly behind. February’s closed sales were down 0.2% year over year, while January was down 8.8% year over year. This suggests that while the market is gaining momentum, demand is still stabilizing after the fluctuations of the past couple of years.
Total Sales Volume Increased
With more homes selling in February, it’s no surprise that overall sales volume also increased.
Total sales volume reached $421,223,153 in February, compared to $336,128,367 in January. This reflects the rise in transactions and continued strong home values across the county.
Looking at year-over-year trends, February volume was up 7.3%, while January volume was up 3.4% compared to the same months last year. This indicates that despite slightly fewer transactions overall compared to prior years, the total dollar value of homes being sold remains strong.
Homes Are Taking Slightly Longer to Sell
The average days on market increased from 62 days in January to 67 days in February. While this change is relatively small, it suggests buyers may be taking a bit more time to evaluate their options.
Year over year, days on market are also trending slightly higher. February was up 1.5% compared to last year, while January was up 5.1% year over year. This gradual shift often reflects a market that is becoming more balanced, where homes still sell but may require proper pricing and presentation.
Average Sale Price Adjusted Month to Month
Average home prices experienced a noticeable shift between the two months.
In January, the average sales price was $771,700, while in February it came in at $721,272. Month-to-month fluctuations like this are common and can be influenced by the mix of homes sold, price ranges, and neighborhood activity.
Despite the monthly dip, prices are still higher than this time last year. February’s average price was up 3.2% year over year, while January showed a larger 12.8% year-over-year increase.
This suggests that long-term price growth remains intact, even as the market experiences normal monthly variation.
What These Numbers Suggest About the Market
Taken together, these statistics point to a market that is steady and gradually building momentum as spring approaches.
Inventory is increasing modestly, giving buyers more opportunities. Sales activity picked up significantly from January to February, which is typical as the year progresses. At the same time, homes are taking slightly longer to sell, and pricing growth is stabilizing after stronger gains earlier in the year.
For buyers, this environment can offer a bit more breathing room to evaluate options and negotiate strategically.
For sellers, the data reinforces the importance of proper pricing and preparation. Homes that are well-presented and competitively priced are still attracting strong interest.
Looking Ahead to the Spring Market
Historically, the next few months tend to be some of the most active in the Salt Lake County real estate market. As more listings come online and buyer demand continues to build, we’ll get a clearer sense of how the 2026 market is shaping up.
If you’re thinking about buying or selling this year and want to understand what these trends mean for your specific situation, a personalized market conversation can help bring clarity to your next step.


