
As we closed out the year, Salt Lake County’s single-family housing market showed meaningful shifts from November to December. Rather than a typical year-end slowdown across the board, several key indicators actually strengthened in December. Below is a direct, metric-by-metric comparison of how the market changed—and what those changes mean.
Inventory: Homes Available
-
November: 1,812 homes available (+18.3% YOY)
-
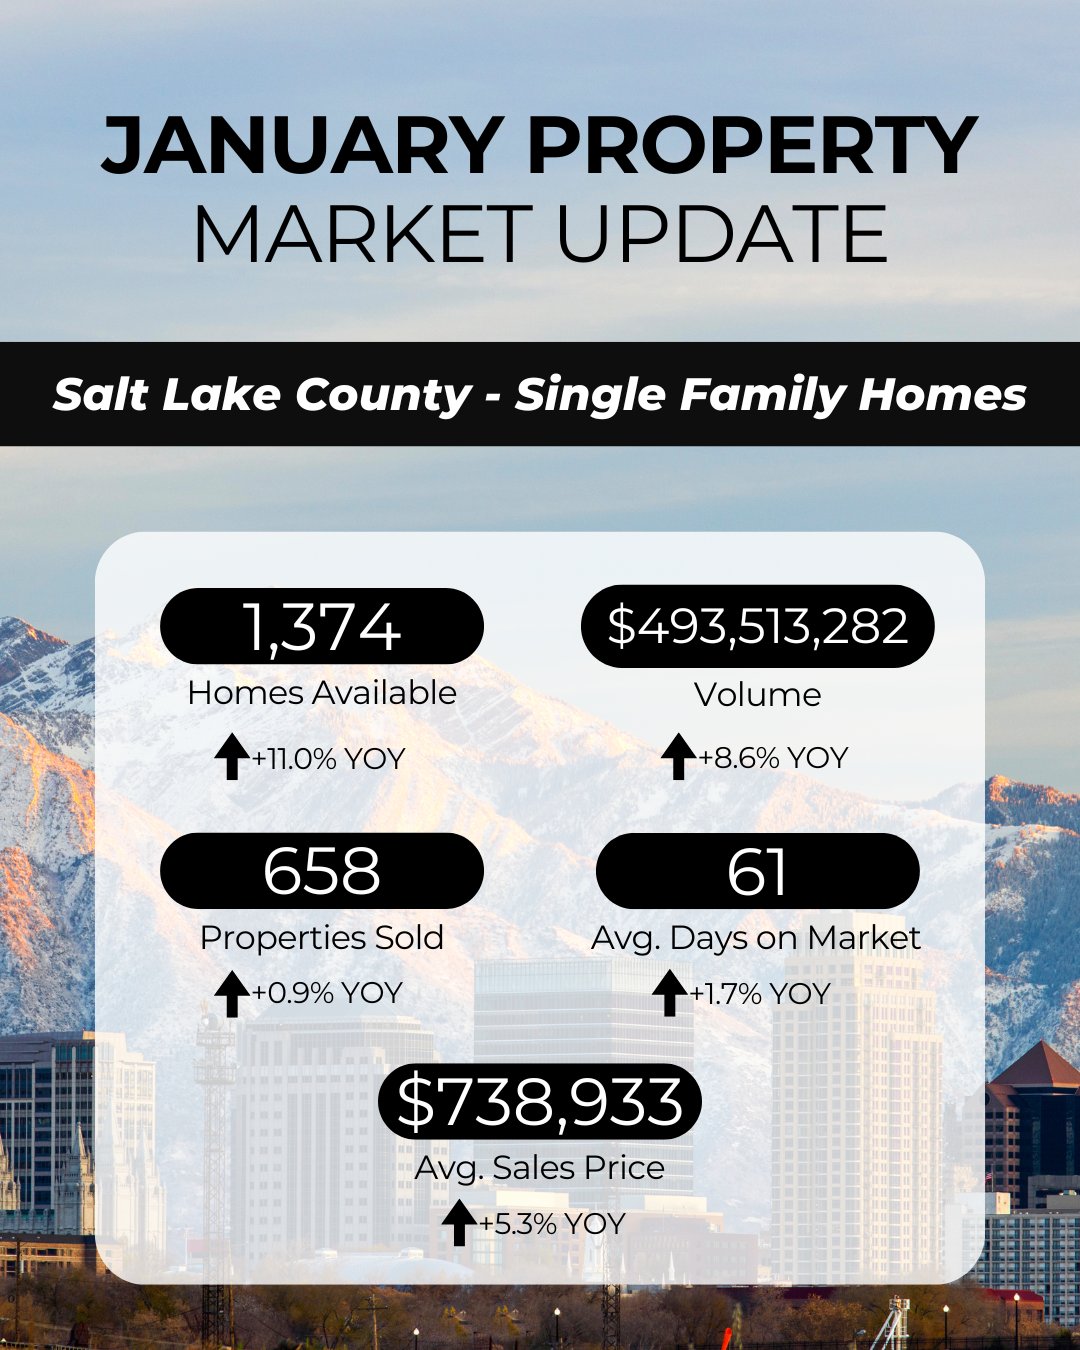
December: 1,374 homes available (+11.0% YOY)
Insight:
Inventory declined month over month, which is typical during the holiday season as fewer sellers list homes. However, both months still showed higher inventory than last year, giving buyers more options than they had in late 2024—especially in November. December’s pullback slightly tightened supply, contributing to increased buyer competition.
Sales Activity: Properties Sold
-
November: 531 homes sold (−11.4% YOY)
-
December: 658 homes sold (+0.9% YOY)
Insight:
November reflected slower buyer activity compared to last year, while December showed a rebound with sales slightly exceeding 2024 levels. This suggests that motivated buyers remained active through the end of the year, especially as inventory tightened and pricing stayed relatively stable.
Total Sales Volume
-
November: $399.6M (−3.4% YOY)
-
December: $493.5M (+8.6% YOY)
Insight:
December significantly outperformed November in total volume, driven by both higher sales counts and stable pricing. This indicates stronger buyer confidence heading into year-end, despite interest rate and affordability considerations.
Market Pace: Average Days on Market
-
November: 53 days (+10.4% YOY)
-
December: 61 days (+1.7% YOY)
Insight:
Homes took longer to sell in December than in November, aligning with typical holiday season patterns. While days on market increased, the smaller year-over-year change in December suggests demand remained relatively healthy compared to prior years.
Pricing: Average Sales Price
-
November: $733,791 (+5.7% YOY)
-
December: $738,933 (+5.3% YOY)
Insight:
Prices remained consistent across both months with steady year-over-year appreciation. While growth slightly softened in December, values held firm—reinforcing that Salt Lake County continues to experience strong long-term demand for single-family homes.
Overall Takeaway
November showed a market taking a breath, with rising inventory and slower sales, while December delivered a stronger finish than many expect for year-end. Inventory tightened, sales activity increased, and prices remained stable. Together, these shifts point toward a balanced but competitive market as we move into the new year.
If you’re curious how these trends apply to your neighborhood or your buying or selling plans, I’m happy to break it down further.


