The Salt Lake County single-family housing market saw some notable shifts from July to August 2025. Let’s break down the numbers and what they mean for buyers and sellers.
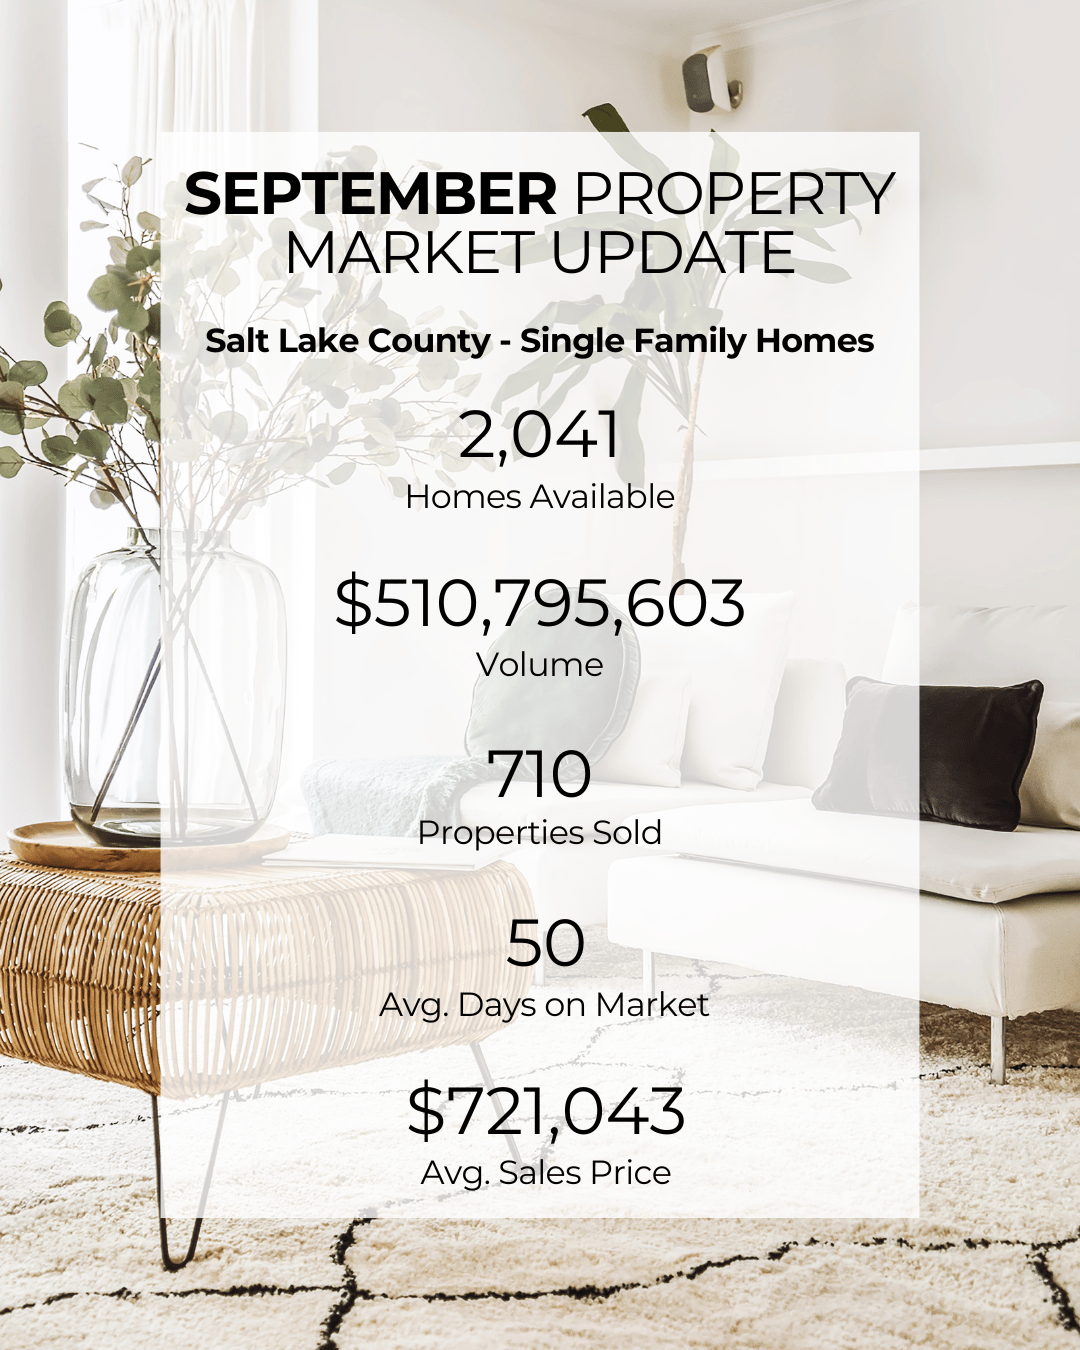
Homes Available
-
July: 2,113
-
August: 2,041
-
Change: ▼ 72 homes
Inventory tightened slightly in August, with fewer homes available on the market. This could increase competition among buyers, especially for desirable properties.
Sales Volume
-
July: $563,227,948
-
August: $510,795,603
-
Change: ▼ $52.4 million
Total sales volume dropped month-over-month, reflecting both fewer homes sold and a dip in average sales prices.
Properties Sold
-
July: 743
-
August: 710
-
Change: ▼ 33 homes
Sales activity slowed in August, suggesting buyers may be exercising more caution or waiting for better conditions.
Average Days on Market
-
July: 47 days
-
August: 50 days
-
Change: ▲ 3 days
Homes stayed on the market slightly longer in August, a small signal of cooling demand compared to the previous month.
Average Sales Price
-
July: $758,045
-
August: $721,043
-
Change: ▼ $37,002
The average sales price saw a meaningful decline of just under 5%. This could indicate buyers are gaining a bit more leverage in negotiations, or that more mid-range homes are being sold compared to July.
Key Takeaways
-
Inventory shrank, but demand softened enough that prices and sales volume dropped.
-
Fewer properties sold, and those that did lingered slightly longer on the market.
-
The dip in average sales price may offer opportunities for buyers who were priced out earlier this summer.
As we move into fall, it will be important to watch whether these trends continue or if seasonal market activity gives sellers renewed strength.