Inventory: Homes Available
December 2025: 1,374 homes available
(+11.0% year over year)
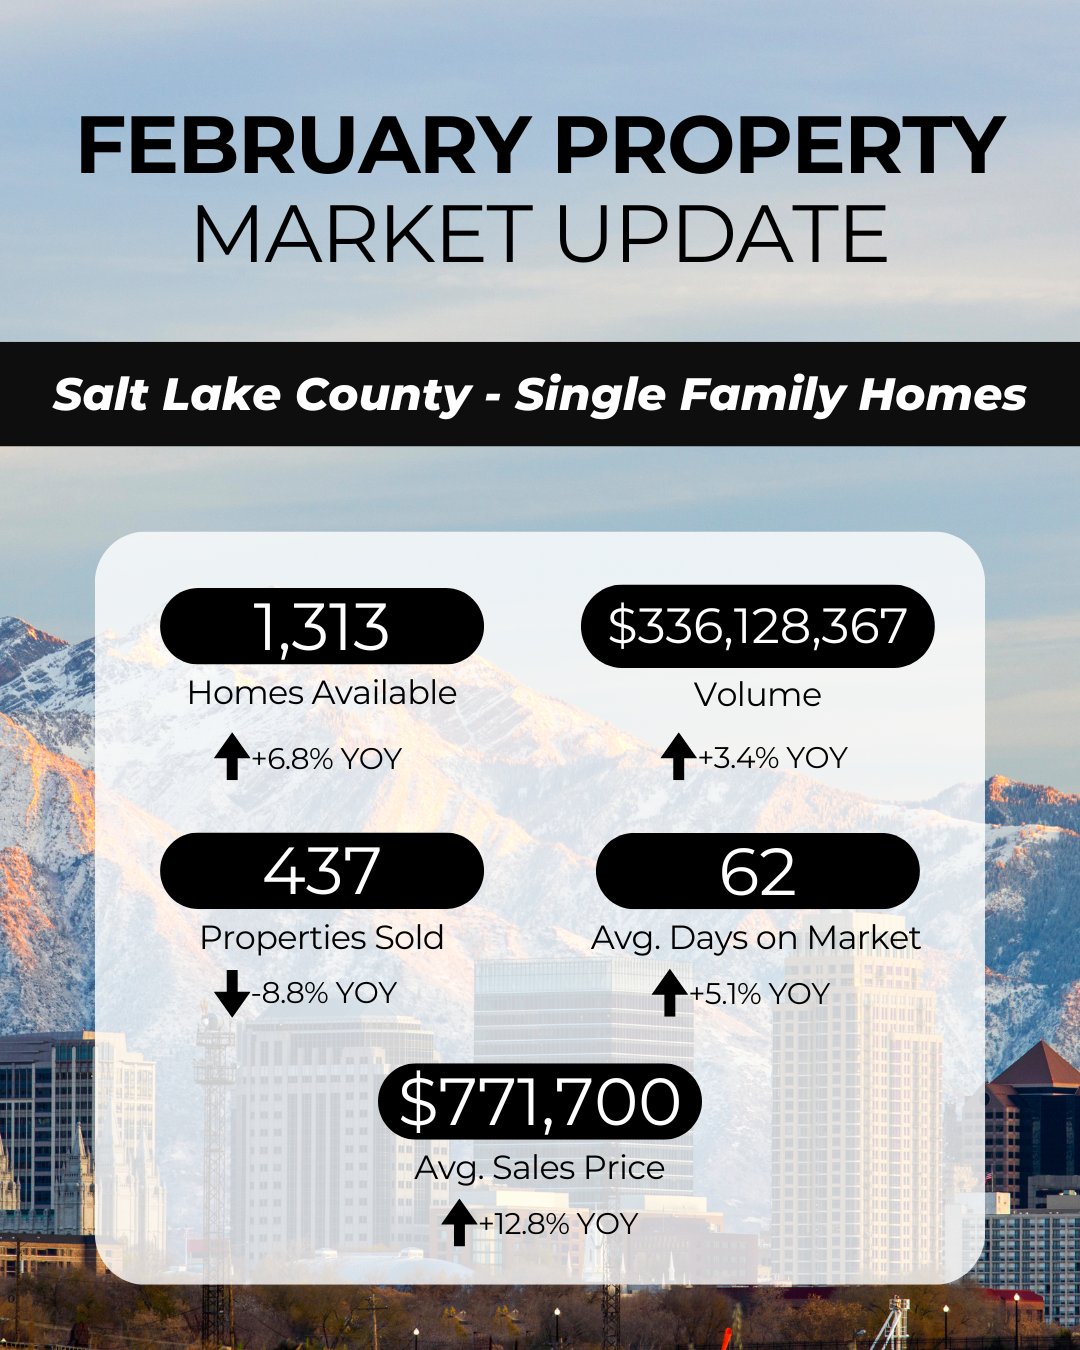
January 2026: 1,313 homes available
(+6.8% year over year)
Inventory dipped slightly from December to January, which is typical as fewer sellers list during the winter months. Even so, the number of homes available remains higher than the same time last year, giving buyers more options than they had entering 2025.
What this tells us:
Inventory is improving, but it’s not oversupplied. Buyers have a bit more breathing room, while sellers still benefit from limited competition if their homes are priced well.
Properties Sold
December 2025: 658 homes sold
(+0.9% year over year)
January 2026: 437 homes sold
(-8.8% year over year)
Sales volume dropped notably from December to January, reflecting the usual post-holiday slowdown. Compared to last year, December slightly outperformed expectations, while January came in below 2025’s pace.
What this tells us:
Buyer activity slows early in the year, but it hasn’t disappeared. Many buyers are still watching closely and preparing to move once conditions feel right — especially those focused on spring timelines.
Total Sales Volume
December 2025: $493,513,282
(+8.6% year over year)
January 2026: $336,128,367
(+3.4% year over year)
Total dollar volume declined from December to January, driven by fewer transactions rather than weaker prices. Both months still posted gains compared to last year, showing that higher home values continue to support overall market strength.
What this tells us:
Even with fewer sales, the market remains financially healthy. Demand at higher price points is still present, and buyer confidence hasn’t dropped off entirely.
Average Days on Market
December 2025: 61 days
(+1.7% year over year)
January 2026: 62 days
(+5.1% year over year)
Homes are taking slightly longer to sell than they did last year, with January showing a modest increase compared to December. This points to a more balanced market where buyers are taking time to evaluate options rather than rushing.
What this tells us:
The days of instant offers are less common, but homes that are priced correctly and well prepared are still selling in a reasonable timeframe.
Average Sales Price
December 2025: $738,933
(+5.3% year over year)
January 2026: $771,700
(+12.8% year over year)
January saw a noticeable jump in average sales price, both month over month and year over year. This suggests continued strength in the upper segments of the market and highlights the long-term upward trend in Salt Lake County home values.
What this tells us:
Pricing remains resilient. While affordability is a concern for some buyers, values have not softened and are continuing to rise — especially for well-located, move-in-ready homes.
The Big Picture
The transition from December to January brought expected seasonal slowdowns, but the year-over-year data paints a clearer picture: demand is still present, prices are holding strong, and the market is settling into a more stable, thoughtful pace.
For sellers, success in early 2026 will depend on realistic pricing and strong presentation. For buyers, increased inventory and longer days on market can create opportunities — especially for those who are prepared and strategic.
If you’re considering buying or selling this year and want to understand how these trends apply to your specific neighborhood or price range, I’m always happy to help you talk through next steps.