
How did the Salt Lake County real estate market perform last month? Find out here!
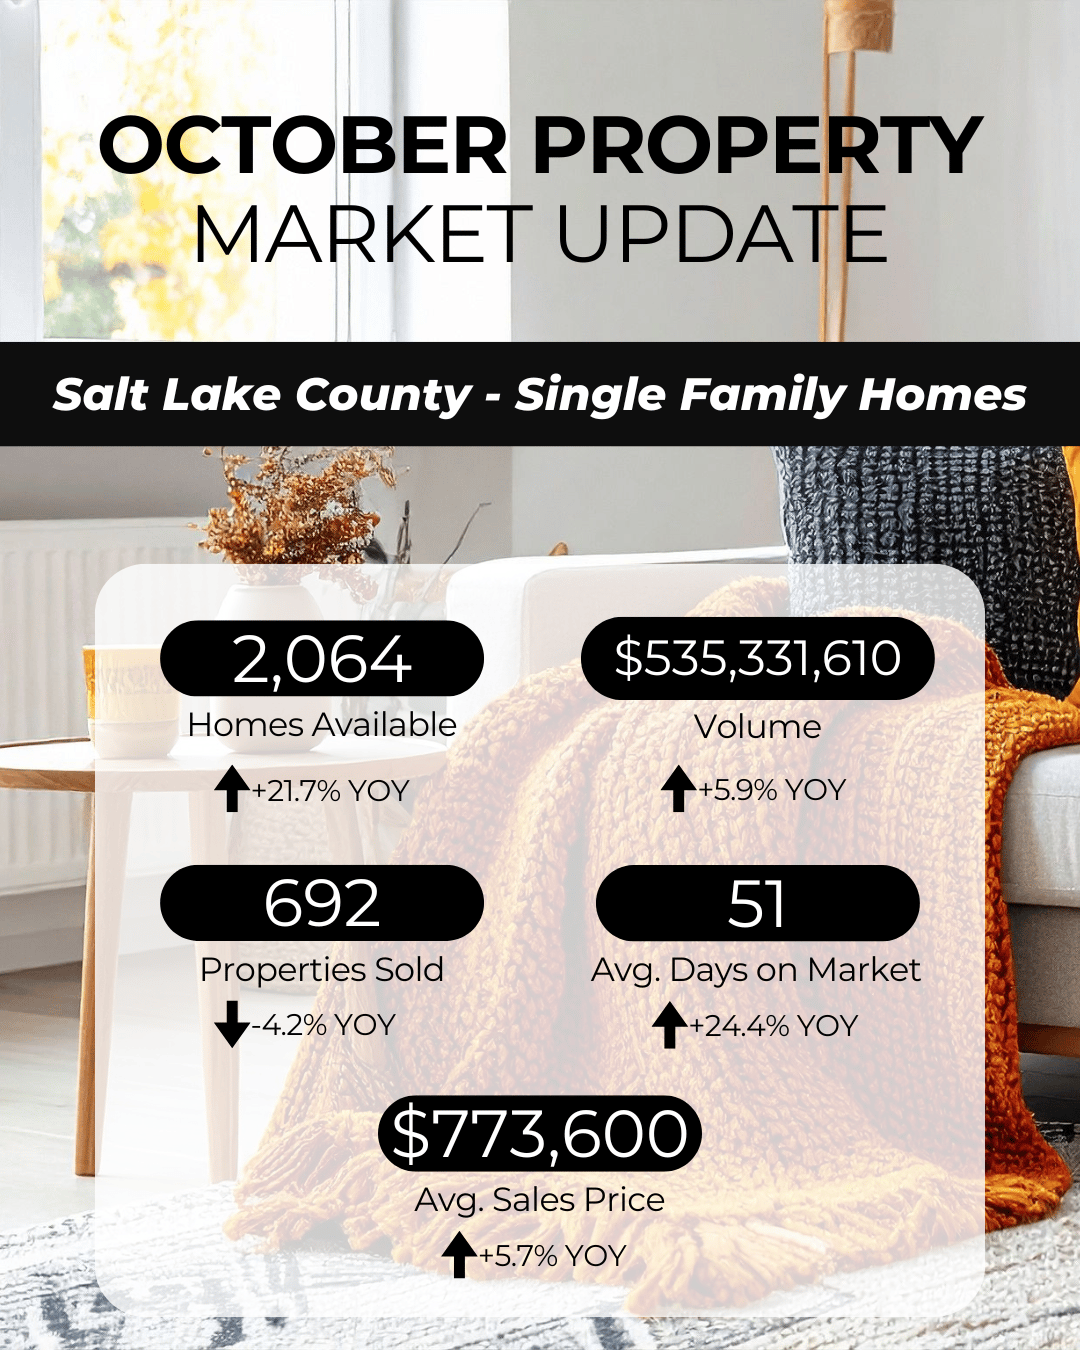
Homes Available
-
August: 2,041
-
September: 2,064 (+23)
-
YOY: +21.7%
Inventory continues to rise, giving buyers more choices and easing competition compared to last year.
Sales Volume
-
August: $510,795,603
-
September: $535,331,610 (+$24.5M)
-
YOY: +5.9%
Even with fewer sales, higher prices pushed overall volume up — showing the market’s resilience.
Properties Sold
-
August: 710
-
September: 692 (-18)
-
YOY: -4.2%
Slight slowdown in closings both month-over-month and year-over-year, reflecting cautious buyer activity.
Average Days on Market
-
August: 50
-
September: 51 (+1)
-
YOY: +24.4%
Homes are staying on the market a little longer, giving buyers more breathing room during negotiations.
Average Sales Price
-
August: $721,043
-
September: $773,600 (+$52,557)
-
YOY: +5.7%
Prices jumped both from last month and last year, a reminder that demand is still driving home values upward.
Overall Insight: October brought a mix of opportunities — buyers benefit from more inventory and slower pace, while sellers still see strong prices.


