
Here’s a comparison of the April and March property market updates for Salt Lake County - Single Family Homes:
Key Differences:
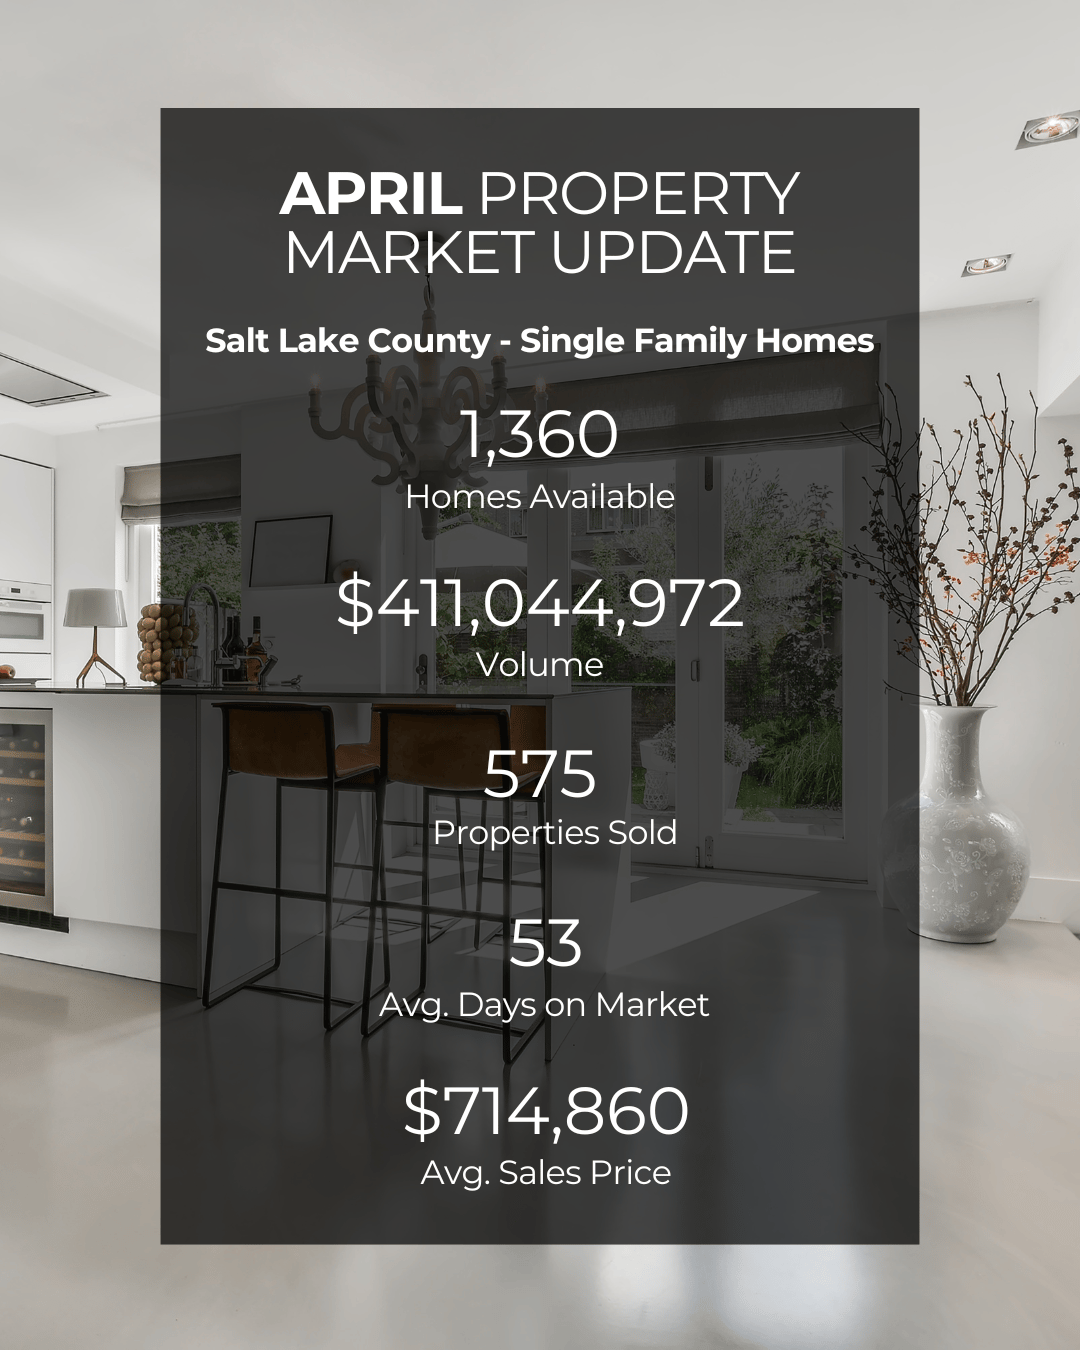
-
Homes Available:
-
March: 1,360 homes (+107 from February)
-
February: 1,253 homes
-
-
Total Volume:
-
March: $411,044,972 (+$50,590,101 from February)
-
February: $360,454,871
-
-
Properties Sold:
-
March: 575 homes (+65 from February)
-
February: 510 homes
-
-
Average Days on Market:
-
March: 53 days (-13 days from February)
-
February: 66 days
-
-
Average Sales Price:
-
March: $714,860 (+$7,851 from February)
-
February: $707,009
-
Market Trends Observed:
More homes available – Inventory has increased.
More properties sold – Indicating a more active market.
Homes are selling faster – Average days on market have decreased.
Higher total sales volume – More transactions and higher home values.
Slight increase in average sales price – Suggesting possible demand growth.
Overall, the market appears to be heating up with increased activity, faster sales, and a steady rise in prices!


