
Here’s how the market performed in September compared to August, along with key year-over-year (YOY) insights!
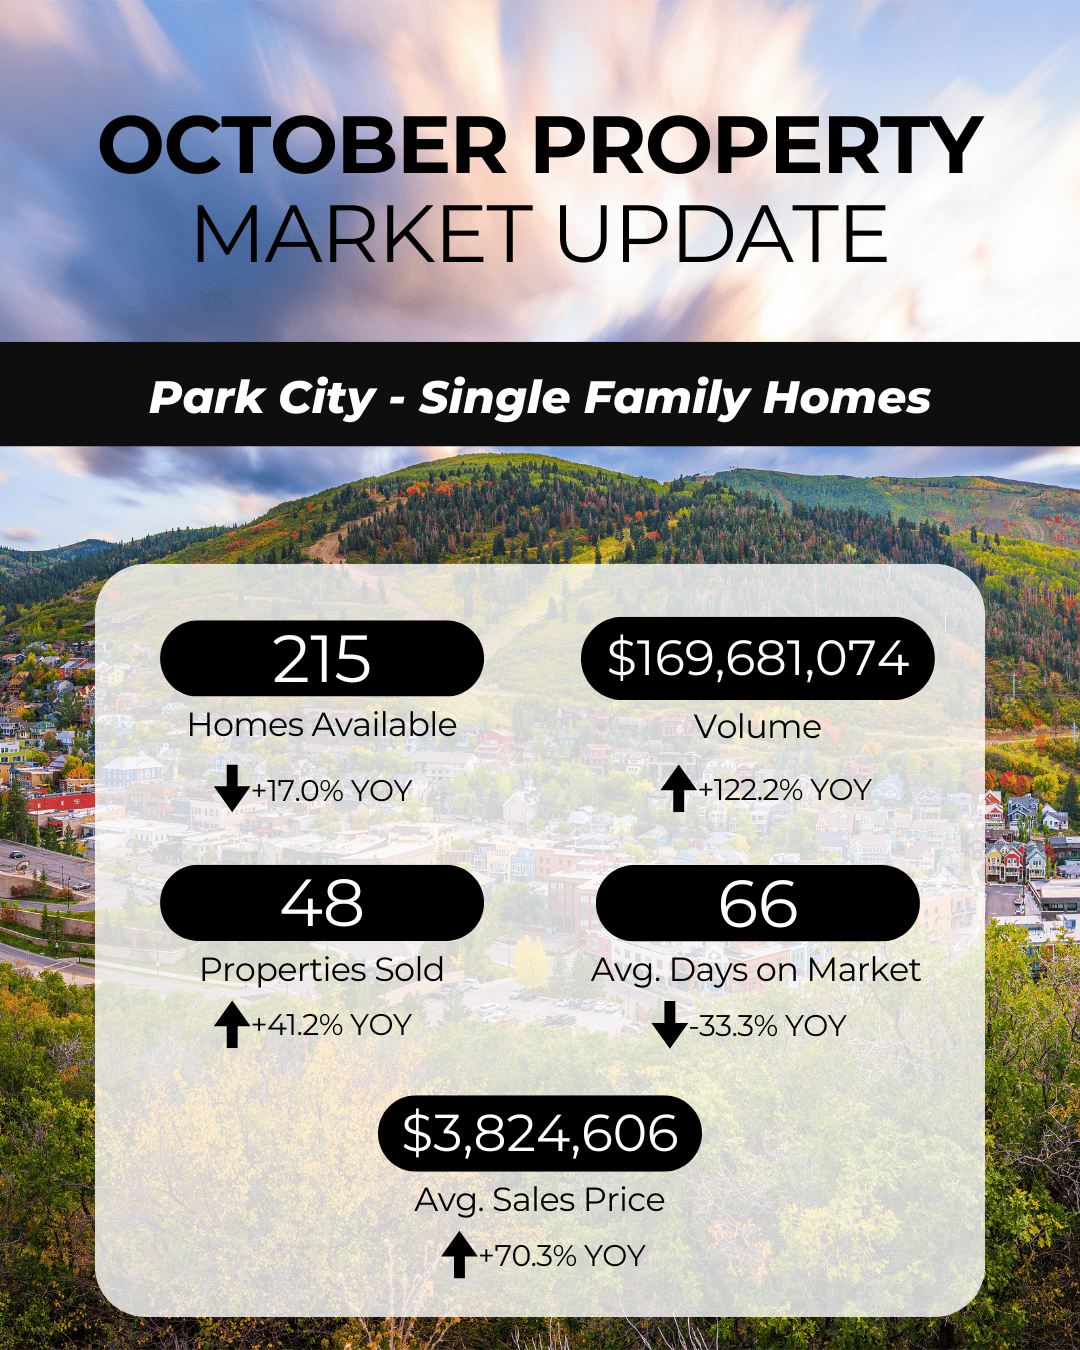
Homes Available
-
September: 215 homes
-
August: 245 homes
-
Change: Down 12% month-over-month
-
YOY: Down 17%
-
Takeaway: Inventory tightened in October, suggesting sellers are holding back and buyers have fewer options.
Total Sales Volume
-
September: $169,681,074
-
August: $188,205,622
-
Change: Slight decrease month-over-month
-
YOY: Up 122.2%
-
Takeaway: Despite fewer listings, overall sales volume remains strong due to higher-priced transactions and continued demand in the luxury market.
Properties Sold
-
September: 48
-
August: 50
-
Change: Relatively steady month-over-month
-
YOY: Up 41.2%
-
Takeaway: Buyer activity remains healthy, with more homes selling compared to last year.
Average Days on Market
-
September: 66 days
-
August: 151 days
-
Change: Down significantly month-over-month
-
YOY: Down 33.3%
-
Takeaway: Homes are selling much faster, signaling strong buyer motivation and properly priced listings.
Average Sales Price
-
September: $3,824,606
-
August: $3,764,112
-
Change: Slight increase month-over-month
-
YOY: Up 70.3%
-
Takeaway: The average price continues to climb, driven by demand for high-end homes and limited supply.
Overall Insight
-
Park City’s market remains active and resilient.
-
Inventory is tightening, but homes are moving faster.
-
Prices and sales volume continue to show strength year-over-year.
-
Buyers and sellers alike should stay informed as the market shifts toward more balanced conditions.


